plot
functions:
Figure
and
Axes
import numpy as np
import pandas as pd
import matplotlib.pyplot as plt

#Create a Series.
n = 10
index = pd.RangeIndex(n, name = "Hour")
data = np.arange(n)
series = pd.Series(data = data, index = index, name = "Temperature")
print(series)

#The Figure fills the window.
figure = plt.figure(figsize = [6.4, 4.8])   #width and height in inches
figure.canvas.set_window_title("matplotlib Series.plot")

#A Figure can contain one or more Axes.
#In this program, the Figure contains only one Axes.
axes = series.plot(color = "#1f77b4", grid = True, linewidth = 1.5)
axes.set_title("Temperature at each hour")
axes.set_ylabel(series.name)

plt.show()   #infinite loop
Hour
0    0
1    1
2    2
3    3
4    4
5    5
6    6
7    7
8    8
9    9
Name: Temperature, dtype: int64
The window on my Mac screen was a bit smaller than 6.4 × 4.8 inches.
Why?
When I pressed the button with the floppy disk icon,
the
.png
file I got on my Mac
(shown below)
was 1280 × 960 pixels.
Why wasn’t it 640 × 480?
To see the default values for the parameters,
use the
plt.rcParams
dictionary.
import sys
import matplotlib.pyplot as plt

params = [
    "figure.figsize",   #width and height, in inches
    "figure.dpi",       #dots per inch
    "savefig.dpi",
    "lines.color",
    "lines.linewidth"   #in points
]

for param in params:
    print(f"plt.rcParams[{param}] = {plt.rcParams[param]}")

cycler = plt.rcParams["axes.prop_cycle"]
i = int(plt.rcParams["lines.color"][-1])
print(f'default line color (#RRGGBB) = {list(cycler)[i]["color"]}')
print()

sys.exit(0)
plt.rcParams[figure.figsize] = [6.4, 4.8]
plt.rcParams[figure.dpi] = 100.0
plt.rcParams[savefig.dpi] = figure
plt.rcParams[lines.color] = C0
plt.rcParams[lines.linewidth] = 1.5
default line color (#RRGGBB) = #1f77b4
In place of
axes = series.plot(color = "#1f77b4", grid = True, linewidth = 1.5)try one of the following.
axes = series.plot.line(color = "#1f77b4", grid = True, linewidth = 1.5) #Does the same thing.

axes = series.plot(grid = True, marker = "o")                            #or try marker = "s"
axes = series.plot(grid = True, linestyle = "None", marker = "o")        #or try linestyle = "dashed"
axes = series.plot(drawstyle = "steps-mid", grid = True, marker = "o")   #or try drawstyle = "steps-post"

axes = series.plot.bar(rot = 0) #vertical bar chart; try rot = 45
axes = series.plot.barh()       #horizontal bar chart
By default, each plot is drawn in the most recently created
Figure.
import numpy as np
import pandas as pd
import matplotlib.pyplot as plt
n = 10
index = pd.RangeIndex(n, name = "Hour")
data = np.arange(n)
series = pd.Series(data = data, index = index, name = "Temperature")
print(series)
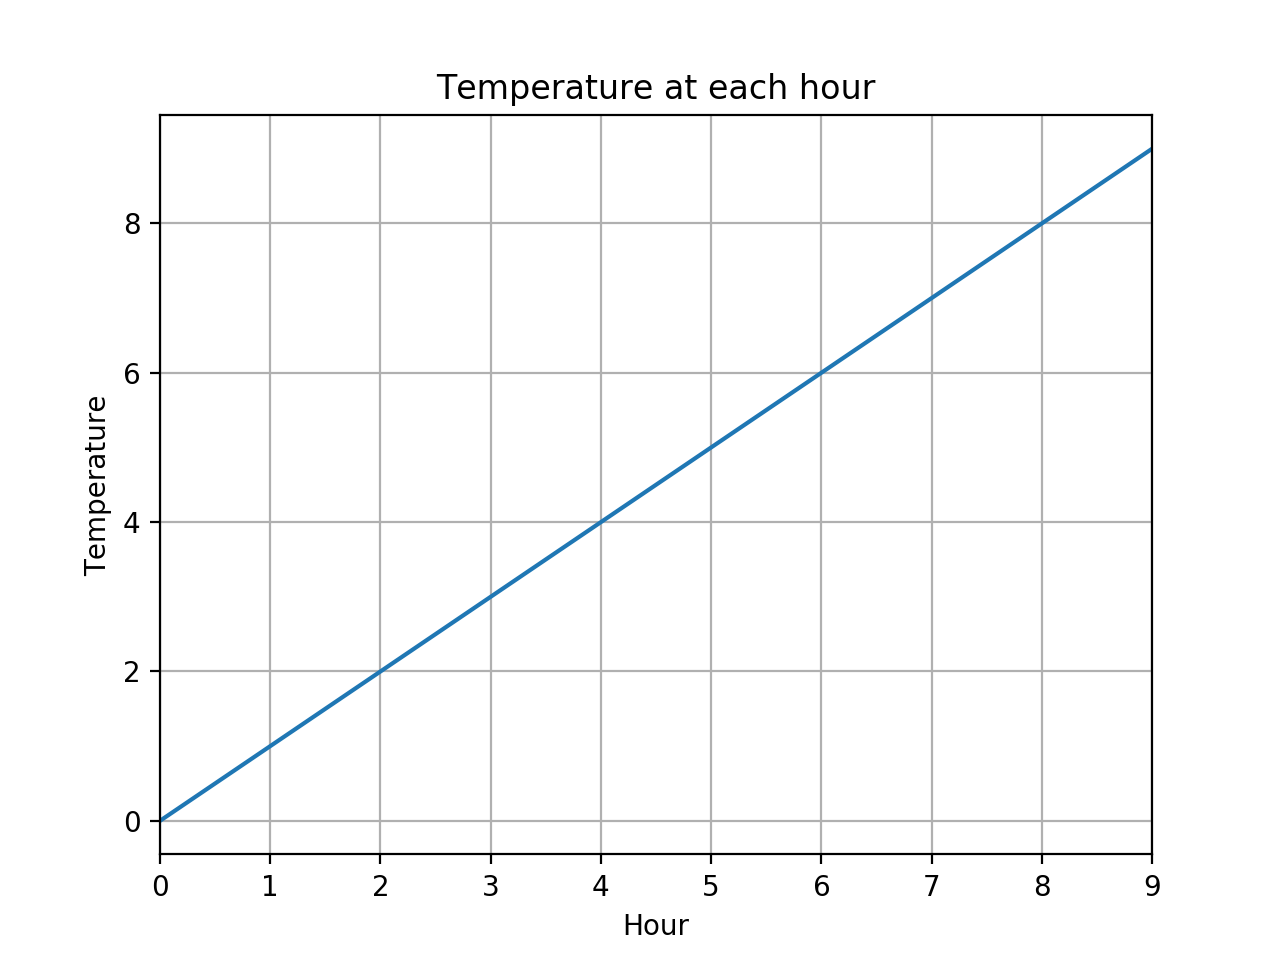
figure0 = plt.figure()
figure0.canvas.set_window_title("matplotlib Series.plot.line")
axes0 = series.plot.line(grid = True)
axes0.set_title("Temperature at each hour")
axes0.set_ylabel(series.name)
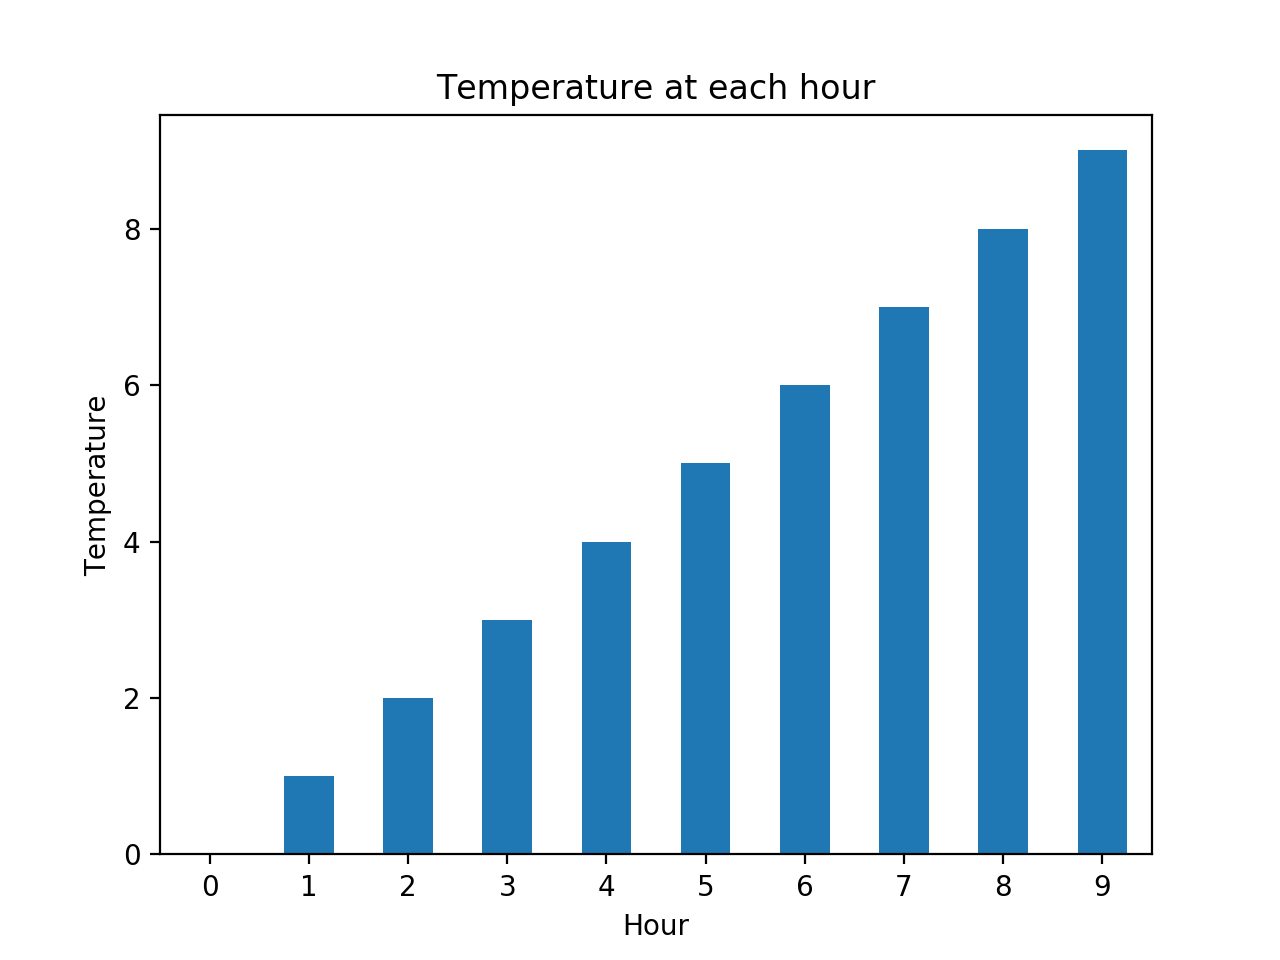
figure1 = plt.figure()
figure1.canvas.set_window_title("matplotlib Series.plot.bar")
axes1 = series.plot.bar(rot = 0)
axes1.set_title("Temperature at each hour")
axes1.set_ylabel(series.name)
plt.show()
Hour
0    0
1    1
2    2
3    3
4    4
5    5
6    6
7    7
8    8
9    9
Name: Temperature, dtype: int64

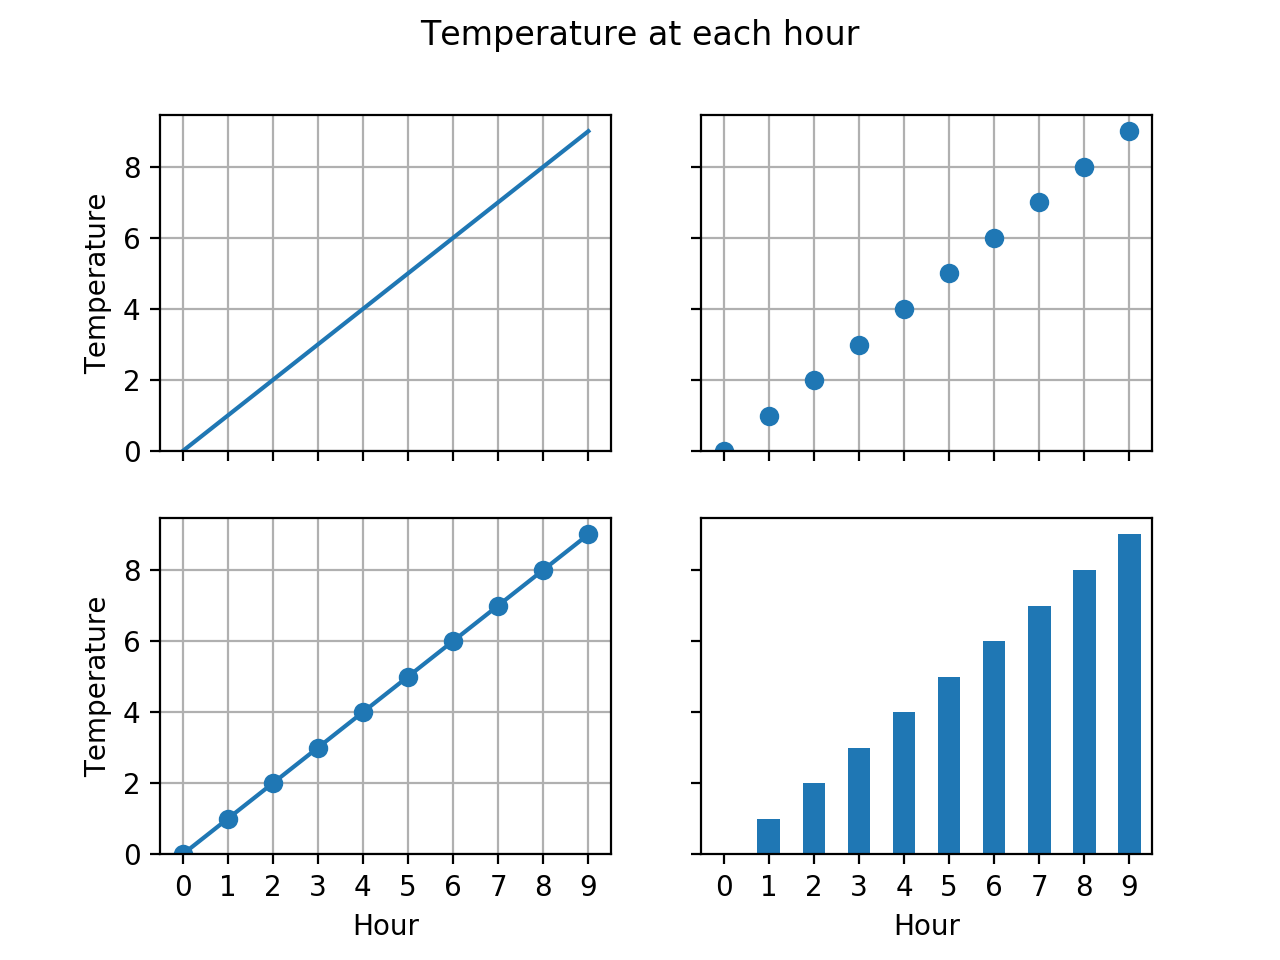
axes
is a 2 × 2
ndarray
containing four
Axes
objects.
import numpy as np
import pandas as pd
import matplotlib.pyplot as plt

n = 10
index = pd.RangeIndex(n, name = "Hour")
data = np.arange(n)
series = pd.Series(data = data, index = index, name = "Temperature")
print(series)

nrows = 2
ncols = 2

figure, axes = plt.subplots(nrows = nrows, ncols = ncols, sharex = True, sharey = True)
figure.canvas.set_window_title("matplotlib Series.plot")
figure.suptitle("Temperature at each hour")

for row in range(nrows):
    axes[row, 0].set_ylabel(series.name)

#upper left
series.plot.line(ax = axes[0, 0], grid = True)

#upper right
series.plot.line(ax = axes[0, 1], grid = True, linestyle = "None", marker = "o")

#lower left
series.plot.line(ax = axes[1, 0], grid = True, marker = "o")

#lower right
series.plot.bar(ax = axes[1, 1], rot = 0)

plt.show()
Hour
0    0
1    1
2    2
3    3
4    4
5    5
6    6
7    7
8    8
9    9
Name: Temperature, dtype: int64